Software and OS Deployment ROI Dashboards
App Portal’s Software Deployment ROI and OS Deployment ROI dashboard reports provide administrators with time and cost savings associated with implementing IT automation by using App Portal for application and OS requests.
To view the Software Deployment ROI and OS Deployment ROI dashboard reports, perform the following steps:
To view the Software Deployment ROI and OS Deployment ROI dashboard reports:
- Set your desired dashboard options, as described in Setting Global Dashboard Options.
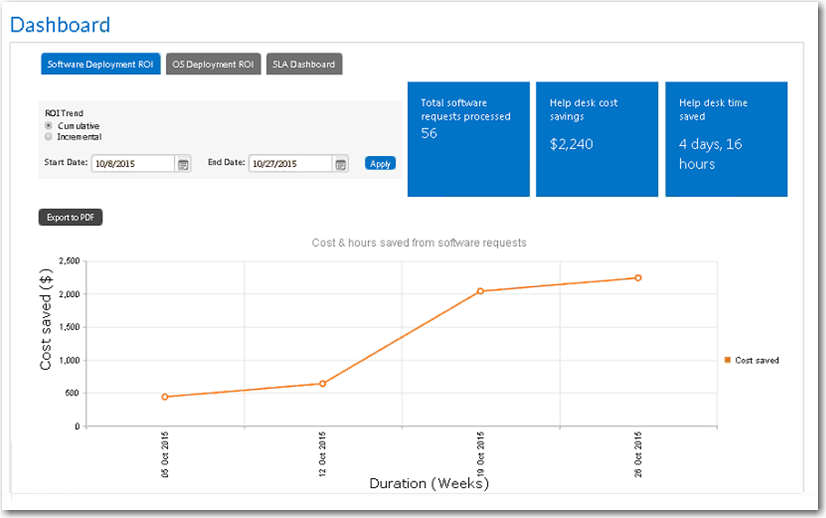
- Open the Dashboard tab and select Software Deployment ROI or OS Deployment ROI .
- Choose the ROI Trend you would like to view by selecting either Cumulative (shows the data growing over time) or Incremental (only includes the data measured during the specified interval).
- Set the desired data interval that you would like to review by making selections from the Start Date and End Date lists, and then click Apply .
- Click on the dots in the line chart to view additional information.
Note the following about these ROI dashboards:
- Software deployment only—The Software Deployment ROI dashboard only includes software requests; it does not include data from general or task sequence requests.
- OSD deployment only—The OS Deployment ROI dashboard only includes OSD requests.
- Duration increment—The duration increment of the line chart (days, weeks, months, quarters, or years) is dependent upon the length of the date range:
| Duration Increment | Length of Date Range |
|---|---|
| Days | 0 to 15 days |
| Weeks | 15 to 105 days |
| Months | 105 days to 15 months |
| Quarters | 15 months to 45 months |
| Years | Over 45 months |